Sunday, 4. September 2005

SOM + genes

Interpreting patterns of gene expression with self-organizing maps: methods and application to hematopoietic differentiation.
-> [pdf]
som yeast
SOMs take a fundamentally different approach. They attempt
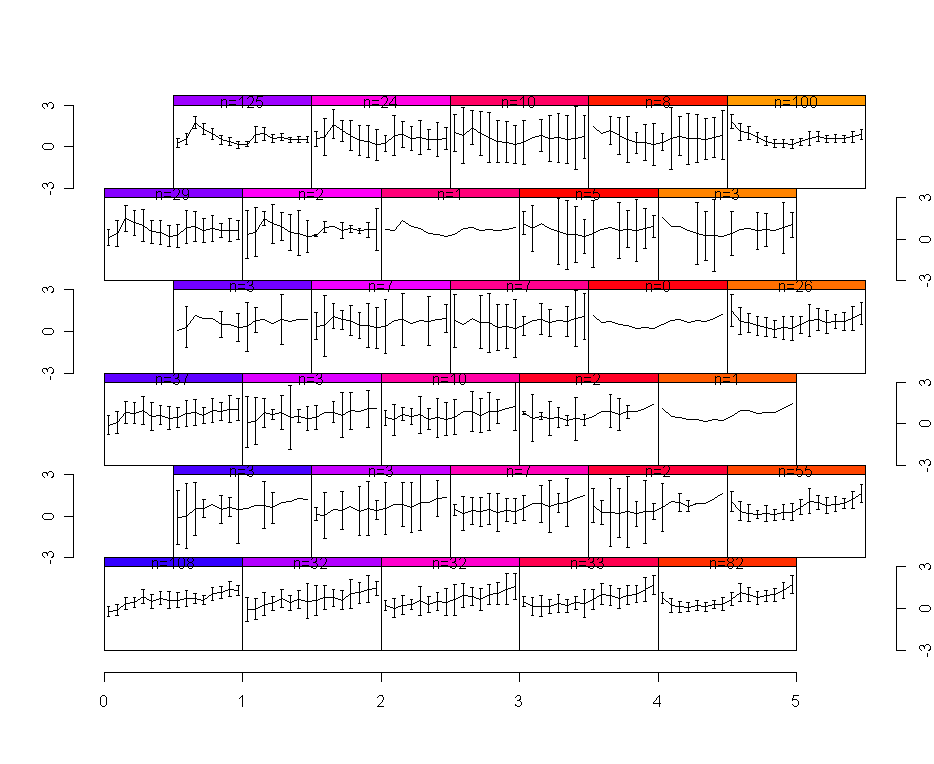
to provide an ‘‘executive summary’’ of a massive data set
by extracting the n most prominent patterns (where n is the
number of nodes in the geometry) and arranging them so that
similar patterns occur as neighbors in the SOM. As with all
exploratory data analysis tools, the use of SOMs involves
inspection of the data to extract insights.
SOMs are widely used in data mining because they have
many desirable mathematical properties, including scaling well
to large data sets. In our own hands, we have indeed found
them valuable in analyses involving hundreds of experiments.


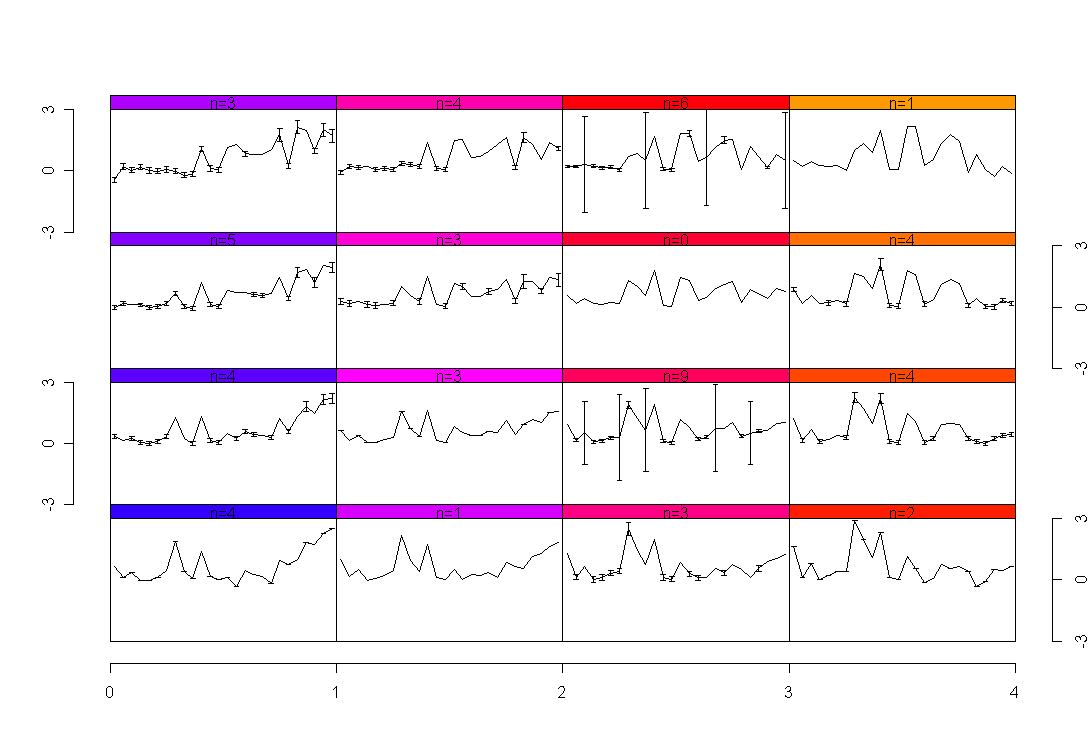
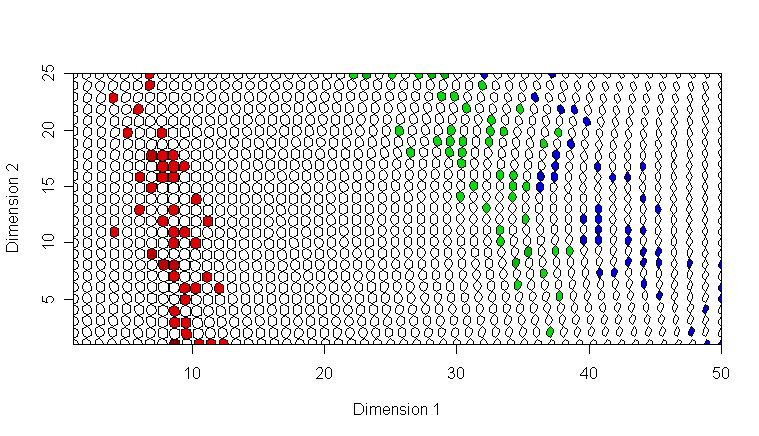
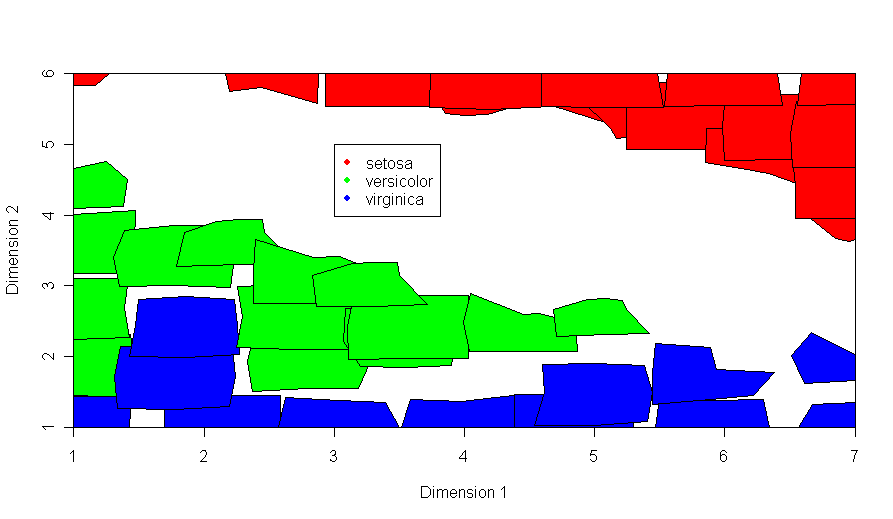
A SOM calculated on the twoday-survey data, with a 4x4 grid, and pre-ordered columns:
som data01
Such a chart wont scale well with a high number of variables.

SOM_PAK

-> http://www.cis.hut.fi/research/som-research/nnrc-programs.shtml
-> http://www.cis.hut.fi/research/som_pak/binaries_windows/

a visualized SOM of the iris data

som-iris
-> Plotting Eight Direction Arranged Maps or Self-Organizing Maps
-> SOM package in R
-> EDAM in R

Same plot, but SOM with a finer grid:
som-iris-2
(Obviously there are not enough data sets to do that)

EDAM-Plot of Iris:
edam-iris
Raabe, N. (2003). Vergleich von Kohonen Self-Organizing-Maps mit einem nichtsimultanen Klassifikations- und Visualisierungsverfahren. Diploma Thesis, Department of Statistics, University of Dortmund.
-> Raabe + Diplomarbeit

Diplomarbeit vergleicht SOM + EDAM hinsichtlich Visualisierungs- (=Topologie-Erhaltungs-)-Güte und Klassifizierungsgüte. Conclusio: SOM erhält räumliche Distanzen (=Toplogie) besser, EDAM klassifiziert besser (Unterschied sei aber bei hochdimensionalen Daten möglicherweise weniger stark).

Wednesday, 17. August 2005

Using the evolutionary algorithm on the survey data

Computation of 200 steps of the evolutionary algorithm for our survey data (500 cases x 26 variables) took more than 5 minutes in R.
bertin-survey
bertin-survey1

Monday, 15. August 2005

...

The cluster- and visualisation algorithm for EigenCluster can be used through a web-form.

Using the data on Irish polls resulted in the following image:
bertin-after
Using the first 100 entries of the twoday dataset I resulted in the following image:
twoday-after
I assume the poor result is caused by the large number of variables which have no entries at all (due to the fact that i just used the first 100 lines of that dataset). Trying to upload the whole dataset failed, probably cause it was too large to be processed by the server.

Thursday, 4. August 2005

bertin.r

http://www.ewas.de/tables/bertin.r
http://www.ewas.de/tables/

                   A B C D E F G H I J K L M N O P
High School        0 0 0 0 0 0 0 1 0 0 1 0 0 0 0 0
Agricultural Coop. 0 1 1 1 0 0 1 0 0 0 0 1 0 0 1 0
Railway Station    0 0 0 0 0 0 0 1 0 0 1 0 0 0 0 0
One-Room-School    1 0 0 0 1 1 0 0 1 1 0 0 1 1 0 1
Veterinary         0 1 1 1 0 0 1 0 0 0 0 1 0 0 1 0
No Doctor          1 0 0 0 1 1 0 0 1 1 0 0 1 1 0 1
No Water Supply    0 0 0 0 0 0 0 0 1 1 0 0 1 1 0 0
Police Station     0 0 0 0 0 0 0 1 0 0 1 0 0 0 0 0
Land Reallocation  0 1 1 1 0 0 1 0 0 0 0 1 0 0 1 0

> bertin(bertin.mat)                   
                   I J N M A F P E H K G C B O D L
Land Reallocation  0 0 0 0 0 0 0 0 0 0 1 1 1 1 1 1
Veterinary         0 0 0 0 0 0 0 0 0 0 1 1 1 1 1 1
Agricultural Coop. 0 0 0 0 0 0 0 0 0 0 1 1 1 1 1 1
High School        0 0 0 0 0 0 0 0 1 1 0 0 0 0 0 0
Railway Station    0 0 0 0 0 0 0 0 1 1 0 0 0 0 0 0
Police Station     0 0 0 0 0 0 0 0 1 1 0 0 0 0 0 0
No Water Supply    1 1 1 1 0 0 0 0 0 0 0 0 0 0 0 0
No Doctor          1 1 1 1 1 1 1 1 0 0 0 0 0 0 0 0
One-Room-School    1 1 1 1 1 1 1 1 0 0 0 0 0 0 0 0
Run1: fitness = -150
Run2: fitness = -150
Run3: fitness = -150

Wednesday, 3. August 2005

Article "A Tribute to J. Bertin's Graphical Data Analysis"

brief summary of that article by Antoine de Falguerolles:
* Article discusses the original idea of the re-orderable matrix, introduced by Jacques Bertin in 1977 in "La graphique et le traitement graphique de l'information".
* J. Bertin introduced a display and an analysis strategy for multivariate data with low or medium sample size. Note: Techniques require manual interaction by the user, therefore not applicable for high-dimensional data!
* The tools operate simultaneously on cases and variables, combining aspects otherwise separately encountered in cluster analysis (on cases) and principal component analysis or factor analysis (on variables).
* The discussed data set were percentual voting results on 9 distinct referenda (=variables) in 42 counties (=cases)
* A threshold was introduced, and all data points exceeding that threshold were highlighted in the matrix
* Bertin discussed several actions of how to re-order the original matrix to find an order with homogenous parts (so called "patches"). Actions included basically shifting and splitting. In order to cope with medium-sized data sets strategies are offered, which take as a first step the correlation among variables into account. Nevertheless the manual interaction remains.
* A quality measure for the re-ordered matrix is a "purity function", which can be defined in several ways that can highly differ in their complexity. A simple purtiy function could be on, where each row or column gets a score by summing up all neighboring pairs of that row/column that are in the correct order.
* Falguerolles mentiones the possible problem of differing scales among observed variables (which can be attacked by using ranks, or by normalising the data)
* Bertin matrices can be viewed as special parallel coordinate plots [Inselberg 96] While usual parallel coordinate plots use variables for ordinates, Bertin matrices conventionally operate on the transposed matrix using cases for ordinates...they are [also] related to techniques like the biplot [Gabriel, 71];

All in all the question remains of how to automatically perform a "correct" re-ordering with high(est)-dimensional-data.

iPlots & JGR

iPlots is a package for R statistical environment (see www.r-project.org) which provides high interaction statistical graphics, written in Java.
-> http://www.rosuda.org/iPlots/index.shtml

iPlots is packaged together with JGR, a Java-based GUI for R.
-> http://stats.math.uni-augsburg.de/JGR/

iPlots provides interactive scatter-, histo- and barplots. Interactivity basically means reformatting the graph (rescaling, rotating,..) and selecting certain data points.

iWidget is also part of JGR and allows the addition of interactive sliders, buttons, etc. to a plot!
w <- iwindow()
add(w, igraphics())
a <- rnorm(100)
plot(density(a))
islider(1, window=w, handler=function(h,...)
    plot(density(a, bw=get.value(h$obj)/300)))
visible(w,TRUE)
iwdget
More highly interesting software packages can be found here:
-> http://www.rosuda.org/software/

Mondrian

Exploratory data analysis with focus on large data and databases.

Mondrian is a statistical data-visualization system written in JAVA. The main emphasis of Mondrian is on visualization techniques for Categorical Data , Geographical Data and LARGE Data.

-> http://www.rosuda.org/Mondrian/

Mosaicplots, Barcharts, Maps, Parallel Coordinates, Boxplots, Scatterplots, Histograms.

Interesting technique: using semi-transperancy to deal with large data
-> http://www.rosuda.org/Mondrian/Mondrian.html#alpha
alphapc
Interactive highlighting of several datapoints (i.e. lines) is possible.

Tuesday, 31. May 2005

some random notes

two (random) ideas at the moment:
* kohonen map on a sphere (also see this related article)
* further investigate into Jacques Bertin's work regarding the reorderable matrix (also see this related article)

Thursday, 26. May 2005

Journal "Information Visualizations"

-> http://www.palgrave-journals.com/ivs/
With free-online access to the most recent articles. All others cost 30$.
E.g. the TOC for Issue 2005/01

Special Types of Clustering - EigenCluster

Spectral Clustering
http://de.wikipedia.org/wiki/Clusteranalyse#Spectral_Clustering
EigenCluster -> http://www-math.mit.edu/cluster/ !!
(with Visualization of Clustering of the Search Results)
software-before

software-after
Multiview Clustering
http://de.wikipedia.org/wiki/Clusteranalyse#Multiview_Clustering

Kohonen Map

A Simulation of a Kohonen map for solving a 'travelling salesman' problem (developed by the TU Wien): http://www.vias.org/simulations/simusoft_travsalm.html
more information on SOMs

Prof Teuvo Kohonen's website

WebSOM:
Self-Organizing Maps for Internet Exploration
an example map of one million newsgroup items

Book on Self-Organizing Maps by Kohonen
The SOM solves difficult high-dimensional and nonlinear problems...A new area is the organization of very large document collections.

a JavaApplet demonstrating the SOM-learning of a 2d-square
(more applets by Rob Saunders can be found here)
som-goodfit
Neural Networks Tutorial with Java Applets !
DemoGNG, a Java applet, implementing several methods related to competitive learning.

BioInformatics

Since one task will be to take a look at various existing technics in the field of bioinformatics, i'm digging through some introductionary materials at wikipedia:
* DNA Microarray: Detecting differences between two sample groups
* Sequence Alignment: Finding similar sequences
* EST = Expressed Sequence Tag (better)

* A Bioinformatics Journal (Oxford)

Application of Clustering:
* Grouping of genes with related expression patterns
* Grouping homologous sequences into gene families

Monday, 16. May 2005

Wikipedia Readings

some wikipedia pointers for later reading:
* http://en.wikipedia.org/wiki/Data_clustering
* http://en.wikipedia.org/wiki/Self-organizing_map
* http://en.wikipedia.org/wiki/Artificial_neural_network
* http://en.wikipedia.org/wiki/Formal_concept_analysis
resp. their (differing) german equivalents:
* http://de.wikipedia.org/wiki/Clusteranalyse
* http://de.wikipedia.org/wiki/Self-Organizing_Maps (!)
* http://de.wikipedia.org/wiki/Neuronales_Netz

Thursday, 12. May 2005

12.5.05 (II)

I did an in-depth studying of the paper 'Relationship-Based Clustering and Visualization for High-Dimension Data Mining'. Detailed notes will follow as soon as i'm finished with the paper.

12.5.05 (I)

Some first findings after playing around with gCluto and a dataset of 1000 twoday stories.

what i did
* i exported the latest 1000 stories from the MySQL twoday.net database to a file named 'twoday.txt'; each row containing the story ID and the content of that story;
* i used the programm doc2mat to build a data matrix containing the term frequencies in a format, that can be imported by gCluto. Since doc2mat can just parse ASCII i had to recode 'twoday.txt' from 'UTF-8' to 'ISO-8859-1' with the UNIX command 'recode UTF-8 twoday.txt', and had to substitue each of the Umlauts (sed -i -e 's/ä/ae/g' twoday.txt);
doc2mat -nostop -minwlen=2 -nlskip=1 -tokfile twoday.txt twoday.mat. I did not use the stop word list, since imo such terms should be filtered out as unimportant by the clustering algorithm itself. doc2mat uses Porter's term stemming algorithm (which is designed for english documents)
* i installed gCluto on my laptop, and imported the twoday.mat file together with its according row- and column-labels.
* i did a first clustering in gCluto with the default settings, that is a 'Repeated Bisection', with the Cosine as a distance measure.

what i found out
* Cluster sizes range from 48 to 323, which is acceptable.
* One of the cluster seems to be one with english documents;
* The most descriptive, and also most descriminating terms are all terms, that are very very common, i.e. words that are supposed to be in a stop word list.
* The most descriptive terms are nearly identical with the most descriminating terms. Not sthg that i expected.
* The matrix visualization does not show any significant 'bands', rather some singular red 'spots'. It remains unclear from the visualization, what really distinguishes the found clusters. (see the screenshots below)
* The mountain visualization looks nice, but at the moment it remains unclear of how that plot is generated, and how it is to be interpretated.

what i still don't know
* A lot more playng around with the clustering options needs to be done, after i studied the manuel of gCluto.
* ...

some screenshots i made

Software du Jour

CLUTO
CLUTO is a software package for clustering low- and high-dimensional datasets and for analyzing the characteristics of the various clusters. CLUTO is well-suited for clustering data sets arising in many diverse application areas including information retrieval, customer purchasing transactions, web, GIS, science, and biology.
Status: not yet evaluated
http://www-users.cs.umn.edu/~karypis/cluto/index.html

gCLUTO
a graphical Cluster Toolkit based upon CLUTO
http://www-users.cs.umn.edu/~karypis/cluto/gcluto/index.html (manual)
Status: first experiments with demo dataset and twoday dataset (also see here)
Note: quite impressive little program to generate matrix visualizations and mountain views of clusterings.

METIS
METIS is a family of programs for partitioning unstructured graphs and hypergraphs and computing fill-reducing orderings of sparse matrices.
Status: not yet evaluated
http://www-users.cs.umn.edu/~karypis/metis/index.html

cviz
A visualization tool designed for analyzing high-dimensional data in large, complex data sets.
Status: evaluated
Note: CViz is a deprecated, un-impressive, non-interactive cluster tool with a restrictive user's license.see screenshot
http://www.alphaworks.ibm.com/tech/cviz

Monday, 18. April 2005

Authors

The two authors of "Relationship-Based Clustering and Visualization for High-Dimensional Data Mining":
http://www.strehl.com
http://www.lans.ece.utexas.edu/~ghosh/

#

Author: Dolnicar, Sara; Leisch, Friedrich:
Title: Getting more out of binary data : segmenting markets by bagged clustering
Link: http://epub.wu-wien.ac.at/dyn/virlib/wp/showentry?ID=epub-wu-01_dd
Status: not yet read

Search


currently reading


William N. Venables, Brian D. Ripley
Modern Applied Statistics with S

Recent Updates

John
Amoxicillin And Clavulanate 250mg With No Prescription...
Smithe526 (guest) - 13. May, 21:03
Hi, I am doing a project...
Hi, I am doing a project for my school using this doc2mat...
Sangeetha (guest) - 2. Mar, 10:35
mountain vizualization...
By the way, here they explain how the mountain visualization...
Tatiana (guest) - 10. Mar, 02:12
hi, I wonder how did...
hi, I wonder how did you make scrin shorts of the mountin...
Tatiana (guest) - 10. Mar, 02:10
SOM + genes
Interpreting patterns of gene expression with self-organizing...
michi - 4. Sep, 23:03

data analysis
diary
linkdump
literature
software
Profil
Logout
Subscribe Weblog