Some first findings after playing around with gCluto and a dataset of 1000 twoday stories.
what i did
* i exported the latest 1000 stories from the MySQL twoday.net database to a file named 'twoday.txt'; each row containing the story ID and the content of that story;
* i used the programm
doc2mat to build a data matrix containing the term frequencies in a format, that can be imported by gCluto. Since doc2mat can just parse ASCII i had to recode 'twoday.txt' from 'UTF-8' to 'ISO-8859-1' with the UNIX command '
recode UTF-8 twoday.txt', and had to substitue each of the Umlauts (
sed -i -e 's/ä/ae/g' twoday.txt);
doc2mat -nostop -minwlen=2 -nlskip=1 -tokfile twoday.txt twoday.mat. I did not use the stop word list, since imo such terms should be filtered out as unimportant by the clustering algorithm itself. doc2mat uses Porter's term stemming algorithm (which is designed for english documents)
* i installed gCluto on my laptop, and imported the twoday.mat file together with its according row- and column-labels.
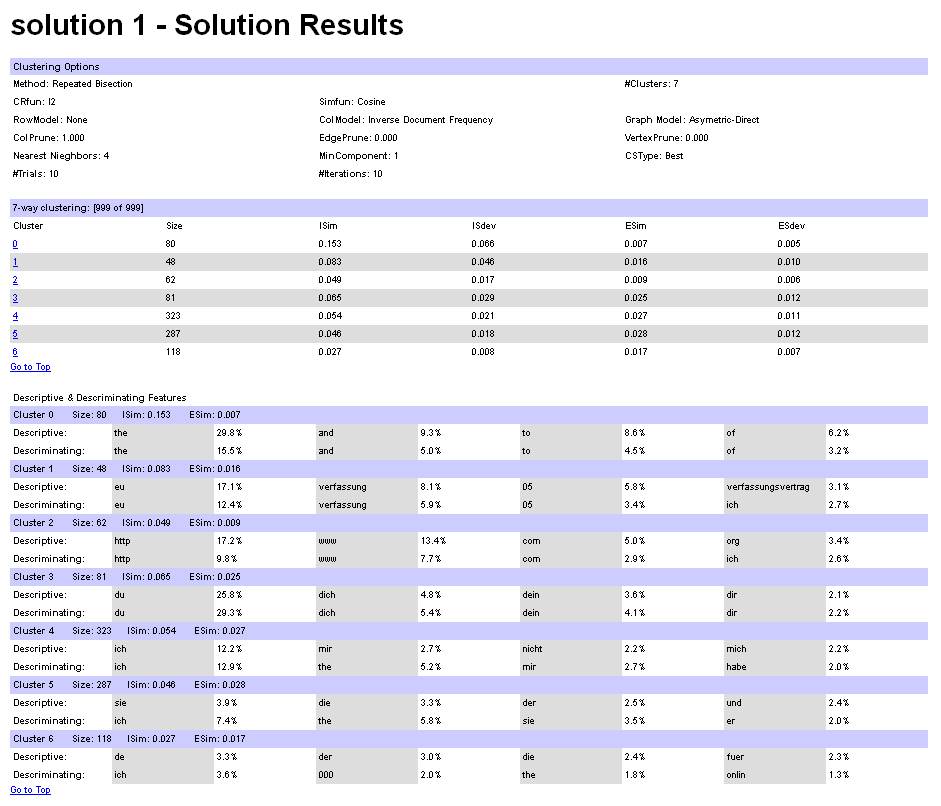
* i did a first clustering in gCluto with the default settings, that is a 'Repeated Bisection', with the Cosine as a distance measure.
what i found out
* Cluster sizes range from 48 to 323, which is acceptable.
* One of the cluster seems to be one with english documents;
* The most descriptive, and also most descriminating terms are all terms, that are very very common, i.e. words that are supposed to be in a stop word list.
* The most descriptive terms are nearly identical with the most descriminating terms. Not sthg that i expected.
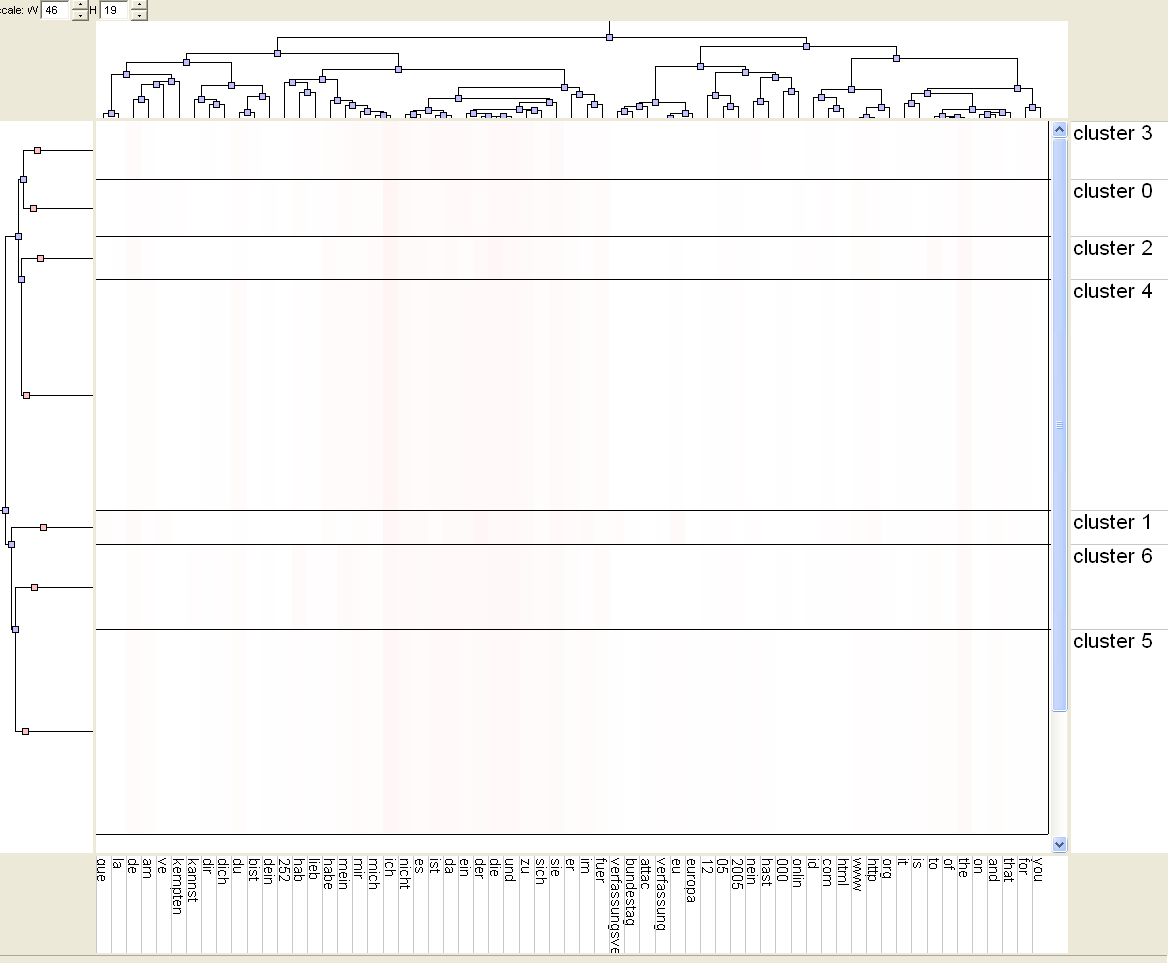
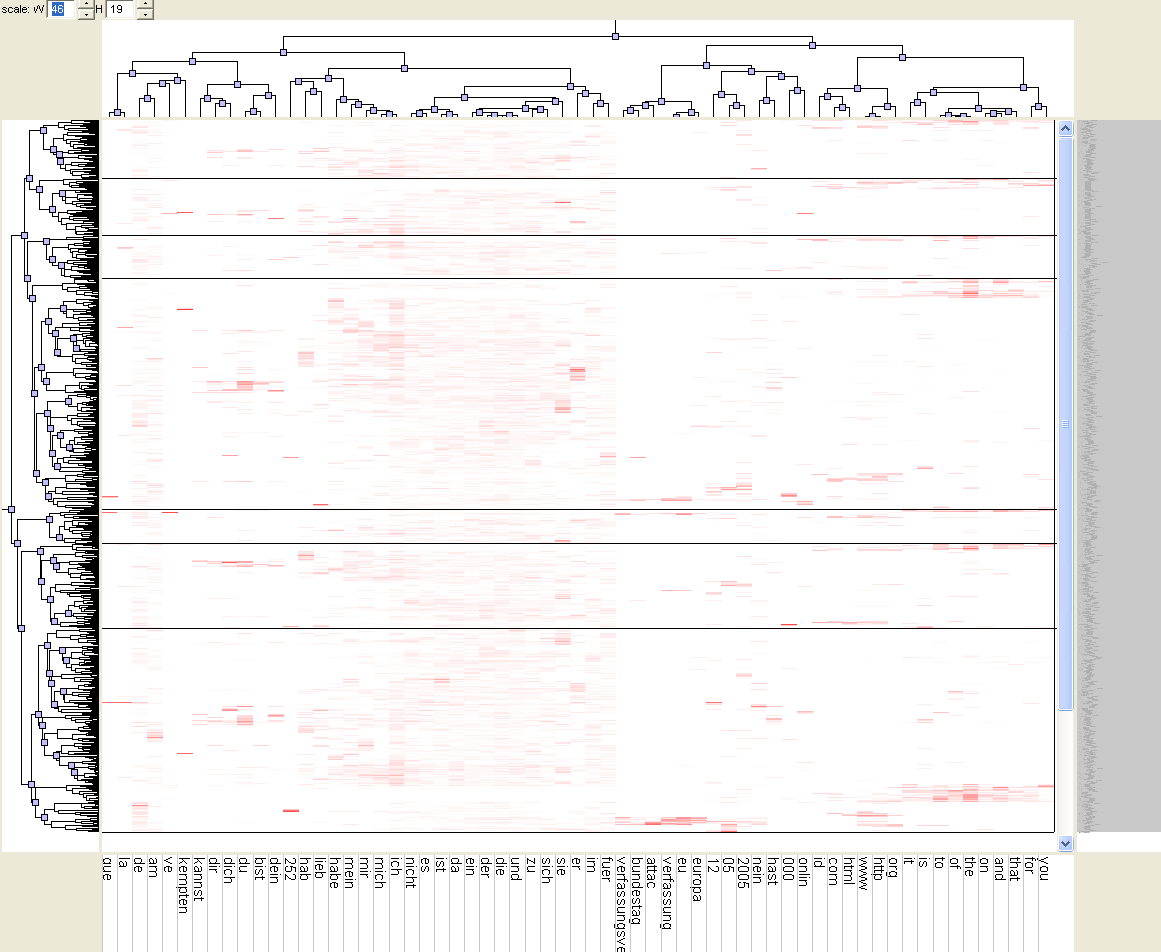
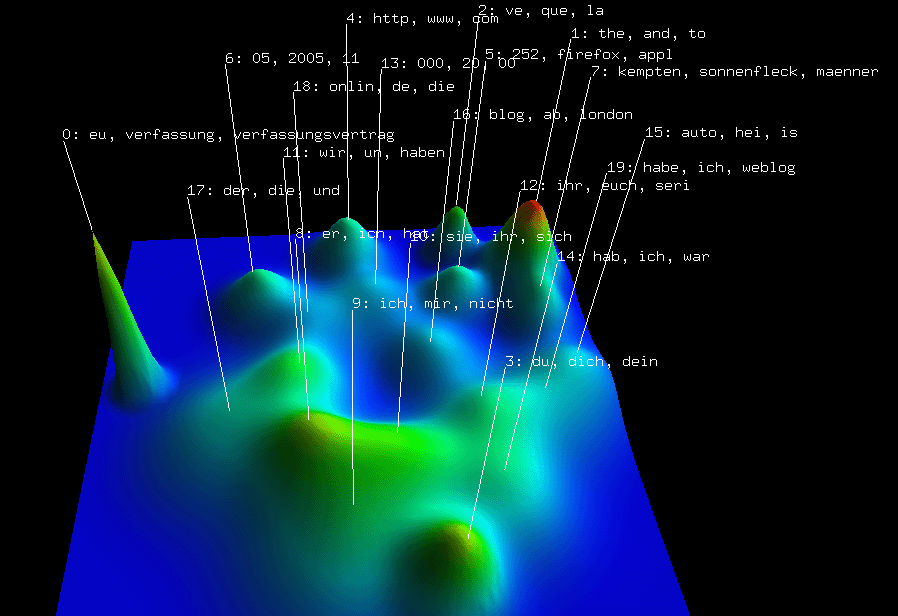
* The matrix visualization does not show any significant 'bands', rather some singular red 'spots'. It remains unclear from the visualization, what really distinguishes the found clusters. (see the screenshots below)
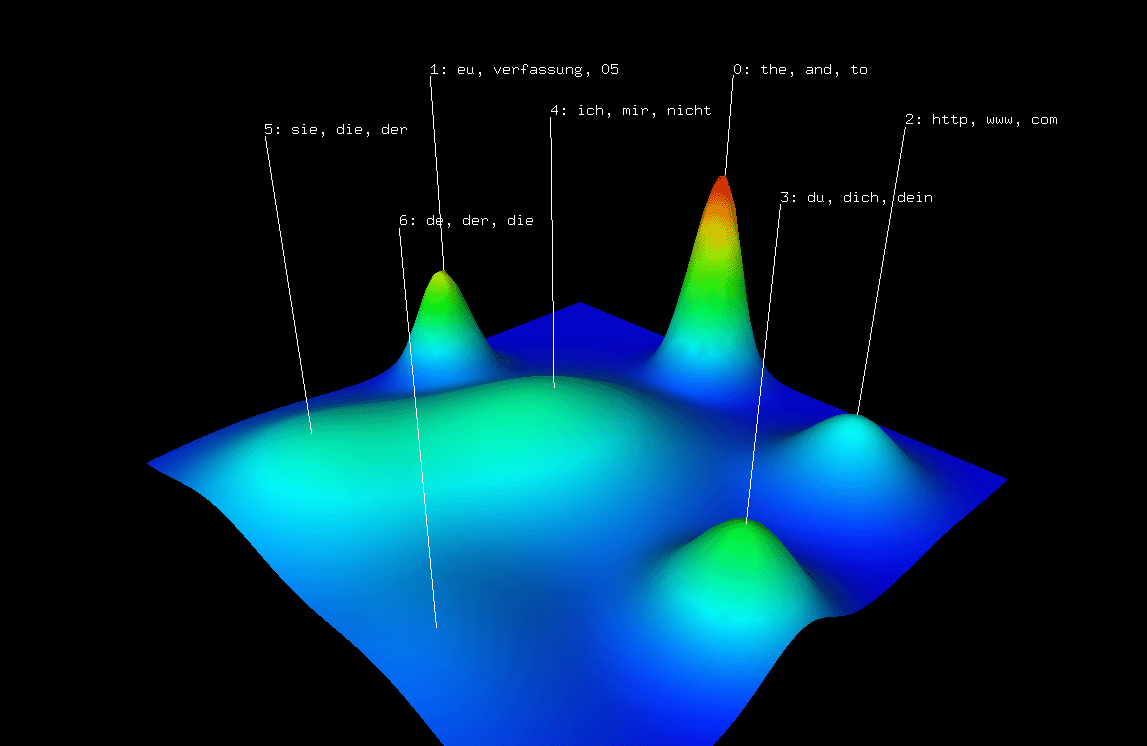
* The mountain visualization looks nice, but at the moment it remains unclear of how that plot is generated, and how it is to be interpretated.
what i still don't know
* A lot more playng around with the clustering options needs to be done, after i studied the manuel of gCluto.
* ...
some screenshots i made
michi - 12. May, 19:41