a visualized SOM of the iris data
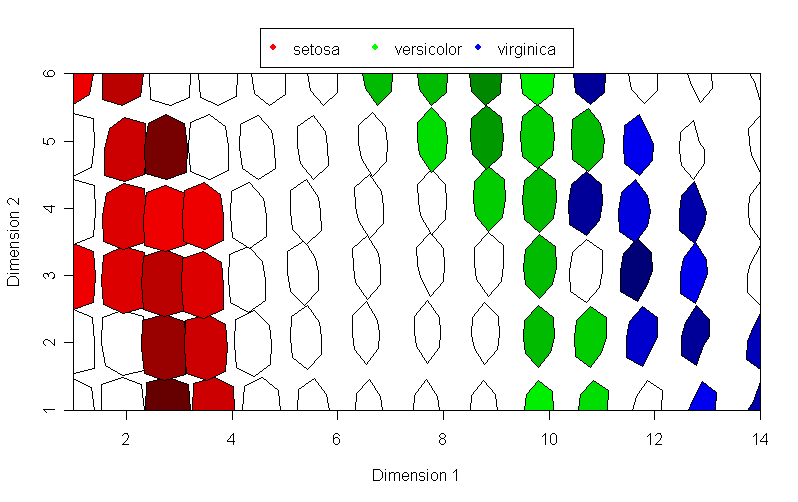
-> SOM package in R
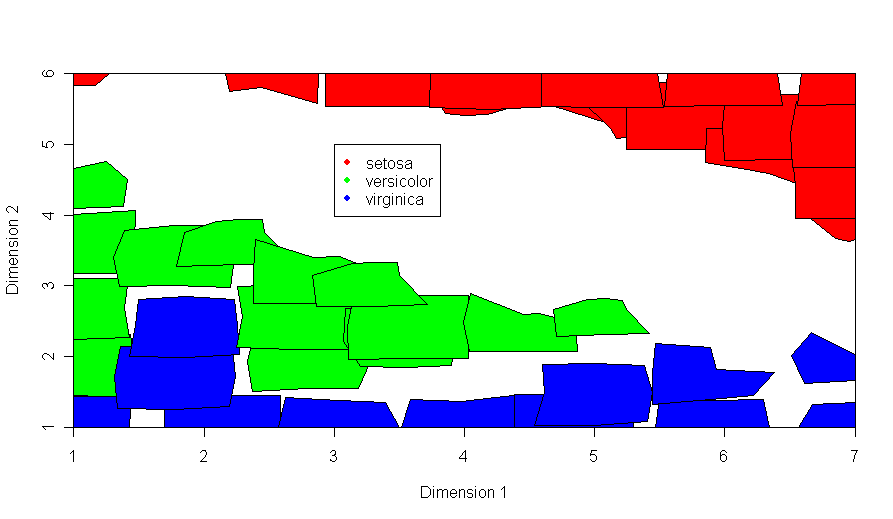
-> EDAM in R
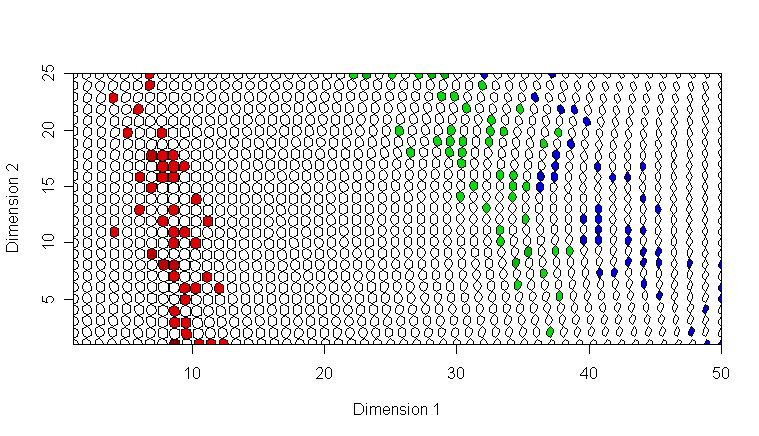
Same plot, but SOM with a finer grid:
EDAM-Plot of Iris:
-> Raabe + Diplomarbeit
Diplomarbeit vergleicht SOM + EDAM hinsichtlich Visualisierungs- (=Topologie-Erhaltungs-)-Güte und Klassifizierungsgüte. Conclusio: SOM erhält räumliche Distanzen (=Toplogie) besser, EDAM klassifiziert besser (Unterschied sei aber bei hochdimensionalen Daten möglicherweise weniger stark).
michi - 4. Sep, 13:58

