Article "A Tribute to J. Bertin's Graphical Data Analysis"
brief summary of that article by Antoine de Falguerolles:
* Article discusses the original idea of the re-orderable matrix, introduced by Jacques Bertin in 1977 in "La graphique et le traitement graphique de l'information".
* J. Bertin introduced a display and an analysis strategy for multivariate data with low or medium sample size. Note: Techniques require manual interaction by the user, therefore not applicable for high-dimensional data!
* The tools operate simultaneously on cases and variables, combining aspects otherwise separately encountered in cluster analysis (on cases) and principal component analysis or factor analysis (on variables).
* The discussed data set were percentual voting results on 9 distinct referenda (=variables) in 42 counties (=cases)
* A threshold was introduced, and all data points exceeding that threshold were highlighted in the matrix
* Bertin discussed several actions of how to re-order the original matrix to find an order with homogenous parts (so called "patches"). Actions included basically shifting and splitting. In order to cope with medium-sized data sets strategies are offered, which take as a first step the correlation among variables into account. Nevertheless the manual interaction remains.
* A quality measure for the re-ordered matrix is a "purity function", which can be defined in several ways that can highly differ in their complexity. A simple purtiy function could be on, where each row or column gets a score by summing up all neighboring pairs of that row/column that are in the correct order.
* Falguerolles mentiones the possible problem of differing scales among observed variables (which can be attacked by using ranks, or by normalising the data)
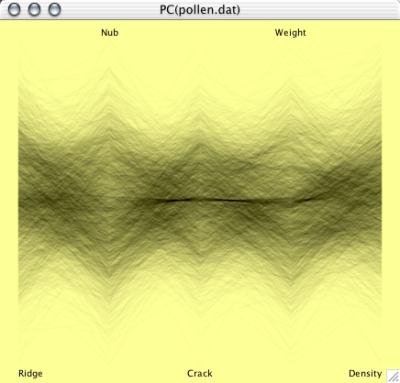
* Bertin matrices can be viewed as special parallel coordinate plots [Inselberg 96] While usual parallel coordinate plots use variables for ordinates, Bertin matrices conventionally operate on the transposed matrix using cases for ordinates...they are [also] related to techniques like the biplot [Gabriel, 71];
All in all the question remains of how to automatically perform a "correct" re-ordering with high(est)-dimensional-data.
* Article discusses the original idea of the re-orderable matrix, introduced by Jacques Bertin in 1977 in "La graphique et le traitement graphique de l'information".
* J. Bertin introduced a display and an analysis strategy for multivariate data with low or medium sample size. Note: Techniques require manual interaction by the user, therefore not applicable for high-dimensional data!
* The tools operate simultaneously on cases and variables, combining aspects otherwise separately encountered in cluster analysis (on cases) and principal component analysis or factor analysis (on variables).
* The discussed data set were percentual voting results on 9 distinct referenda (=variables) in 42 counties (=cases)
* A threshold was introduced, and all data points exceeding that threshold were highlighted in the matrix
* Bertin discussed several actions of how to re-order the original matrix to find an order with homogenous parts (so called "patches"). Actions included basically shifting and splitting. In order to cope with medium-sized data sets strategies are offered, which take as a first step the correlation among variables into account. Nevertheless the manual interaction remains.
* A quality measure for the re-ordered matrix is a "purity function", which can be defined in several ways that can highly differ in their complexity. A simple purtiy function could be on, where each row or column gets a score by summing up all neighboring pairs of that row/column that are in the correct order.
* Falguerolles mentiones the possible problem of differing scales among observed variables (which can be attacked by using ranks, or by normalising the data)
* Bertin matrices can be viewed as special parallel coordinate plots [Inselberg 96] While usual parallel coordinate plots use variables for ordinates, Bertin matrices conventionally operate on the transposed matrix using cases for ordinates...they are [also] related to techniques like the biplot [Gabriel, 71];
All in all the question remains of how to automatically perform a "correct" re-ordering with high(est)-dimensional-data.
michi - 3. Aug, 23:55