Mondrian
Exploratory data analysis with focus on large data and databases.
Mondrian is a statistical data-visualization system written in JAVA. The main emphasis of Mondrian is on visualization techniques for Categorical Data , Geographical Data and LARGE Data.
-> http://www.rosuda.org/Mondrian/
Mosaicplots, Barcharts, Maps, Parallel Coordinates, Boxplots, Scatterplots, Histograms.
Interesting technique: using semi-transperancy to deal with large data
-> http://www.rosuda.org/Mondrian/Mondrian.html#alpha
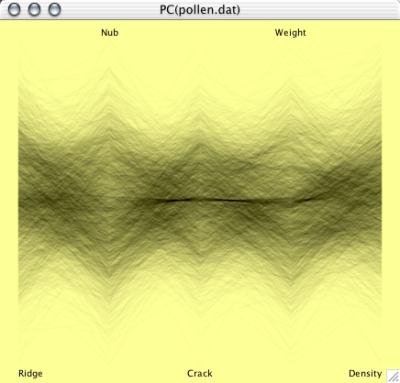
Interactive highlighting of several datapoints (i.e. lines) is possible.
Mondrian is a statistical data-visualization system written in JAVA. The main emphasis of Mondrian is on visualization techniques for Categorical Data , Geographical Data and LARGE Data.
-> http://www.rosuda.org/Mondrian/
Mosaicplots, Barcharts, Maps, Parallel Coordinates, Boxplots, Scatterplots, Histograms.
Interesting technique: using semi-transperancy to deal with large data
-> http://www.rosuda.org/Mondrian/Mondrian.html#alpha
Interactive highlighting of several datapoints (i.e. lines) is possible.
michi - 3. Aug, 23:34

